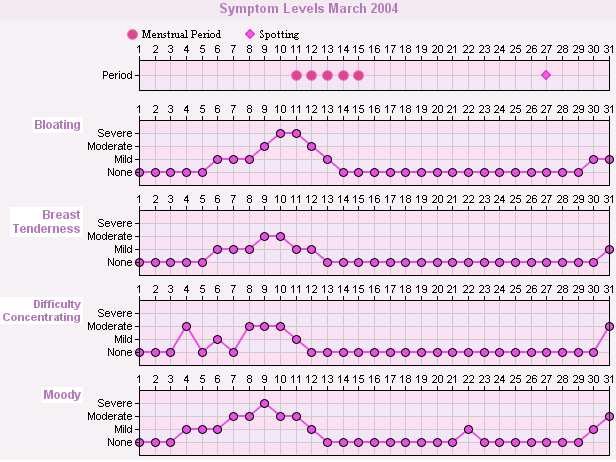
MyMonthlyCharts charts the menstrual and symptom data you've tracked using MyMonthlyCycles. Just select the symptoms you want to chart, the date range (e.g. 3 months, 6 months), and the chart is isntantly generated for you to view or print.
You can group symptoms and print multiple charts. For example, print a chart showing your physical symptoms, and another with your emotional related symptoms. Or, print a given symptom (e.g. moods), and chart it over multiple months.

