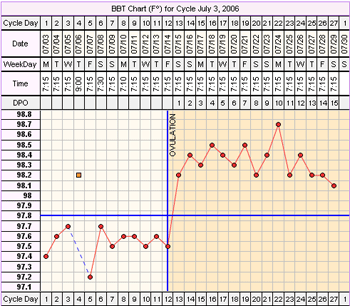
Coverline on BBT Chart
A horizontal coverline can be automatically drawn on your BBT chart based on the cycle day you indicate you ovulated.

The coverline is drawn as follows:
- The BBT temperatures for the 6 days prior to ovulation are read for this cycle. Five of the six must have temps recorded; One discard (or non-recorded temp) is allowed.
- The coverline is drawn 0.1 (Fahrenheit) or 0.05 (Celsius) of a degree above the highest temp.
The coverline is useful to easily see your pre-ovulatory and post-ovulatory temperatures. In a typical biphasic (2 phased) BBT chart, temps are lower prior to ovulation, and higher after ovulation.
Ovulation Shown on Chart
A vertical line is drawn on your BBT chart on the day you indicated you ovulated.
DPO (Days Past Ovulation) on Chart
The DPO row is shown on the BBT chart if you indicated you ovulated during the cycle you are editing/viewing.
Days Past Ovulation (Days 1 to N), also referred to as your luteal phase, is the number of days following ovulation up to the day before your next cycle starts.
The day after ovulation is DPO 1, the second day after ovulation is DPO 2, etc.
In addition to showing the DPO count, this section of the chart (to the right of the ovulation line) is color coded, so you can easily view your luteal phase.
Ovulation Day
To indicate you ovulated, use the I Ovulated Today checkbox on the Fertility Edit screen for the date on which you detected ovulation. If you accidentally mark more than one ovulation day in a cycle, the earliest date is used for displaying DPO and the coverline, and all others are ignored.
Note: Even if you record your ovulation date, if there are not at least 5 days with temperatures prior to the ovulation day in your cycle, the coverline is not drawn. The vertical ovulation line and DPO will be shown on your chart, even if the coverline can not be drawn. This is particularly useful if you are using OPKs and fertility monitors to determine ovulation, since you can see your luteal phase and its length right on your chart.


