MyMonthlyCharts, Premium Fertility, and Perimenopause Journaling are now all FREE!
Page 5 of 8
Feminine Protection Usage
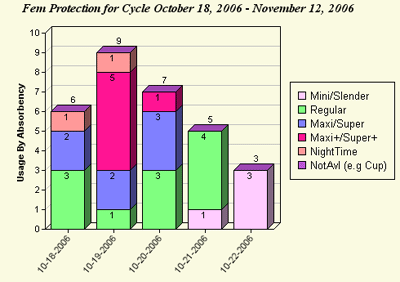
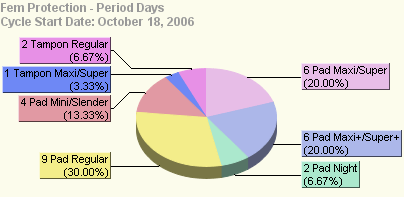
These charts show your feminine protection usage -- a reflection of your flow patterns in each cycle.
The first chart (top) quantifies feminine protection usage by absorbency (e.g. regular, maxi) for each cycle day that you tracked feminine protection. Heavy and light days are easily distinguished.
Its companion chart (bottom) summarizes each cycle's period days, showing overall usage by both protection type and absorbency type.


Screenshots may be reduced in size. All chart data is for demonstration purposes only.


